

Shiba Inu price is down 4.4% at press time as the total crypto market cap slipped below $3 trillion again, as traders who bought into the recent rally sold to take profits. Amid this dip, two key metrics have stood out, suggesting that SHIB price might record another rally in the near term and possibly hit $0.00002.
Shiba Inu Price Eyes $0.00002 Despite Recent Dip
SHIB value today trades at $0.0000131 after retreating from a multi-week high of $0.0000138. Despite this decline, two metrics have flashed bullish signs and given hope to traders that this meme coin might avoid a crash back to its consolidation range.
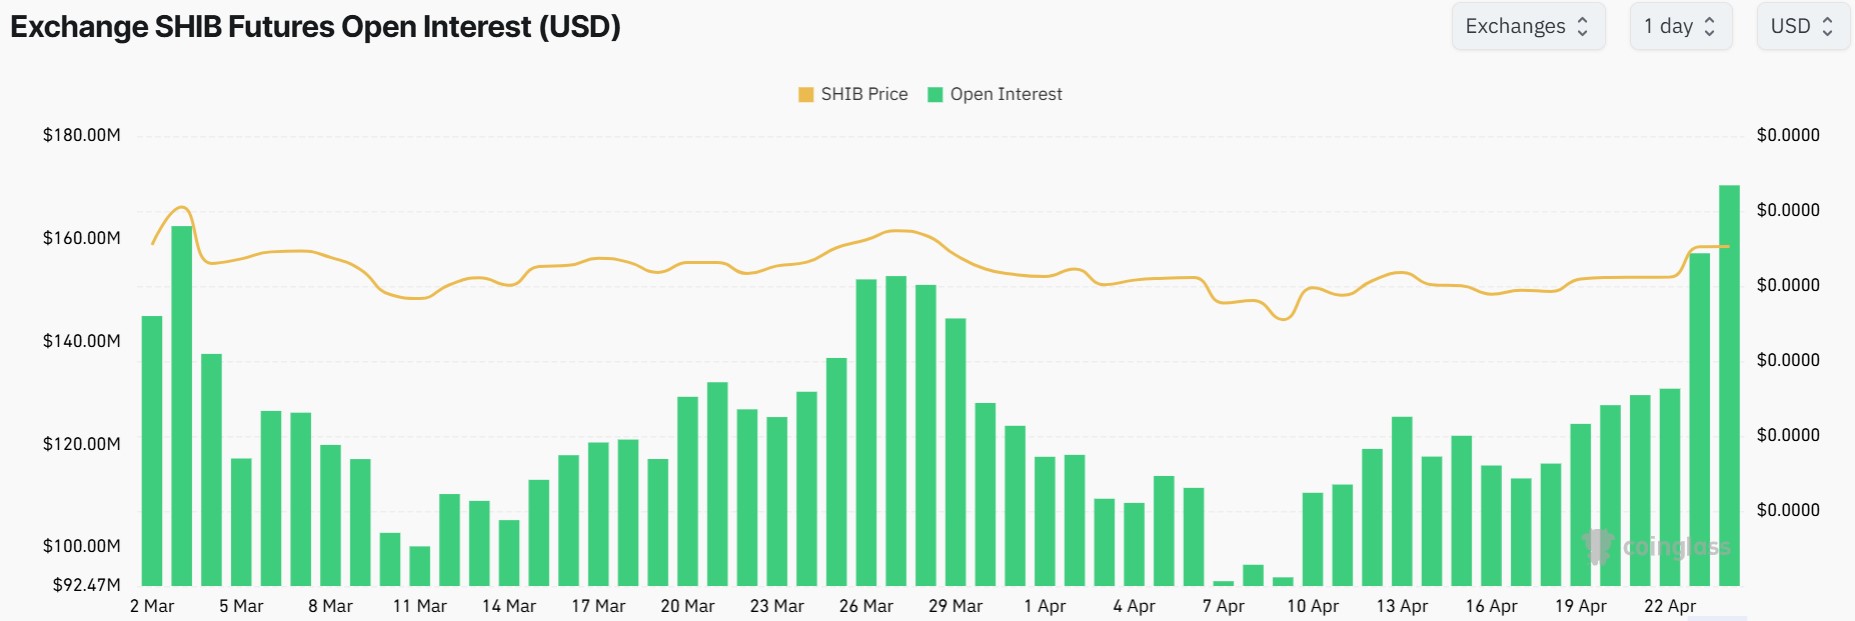
The first metric is open interest, which recently rose to $170M, per data from Coinglass, marking its highest level in over one month. The surging OI indicates that derivative traders are opening new positions on Shiba Inu, as they anticipate that this top meme coin is on the verge of making a major move. Besides, the funding rates are positive, indicating that long traders are more than short sellers, which is also a bullish sign.
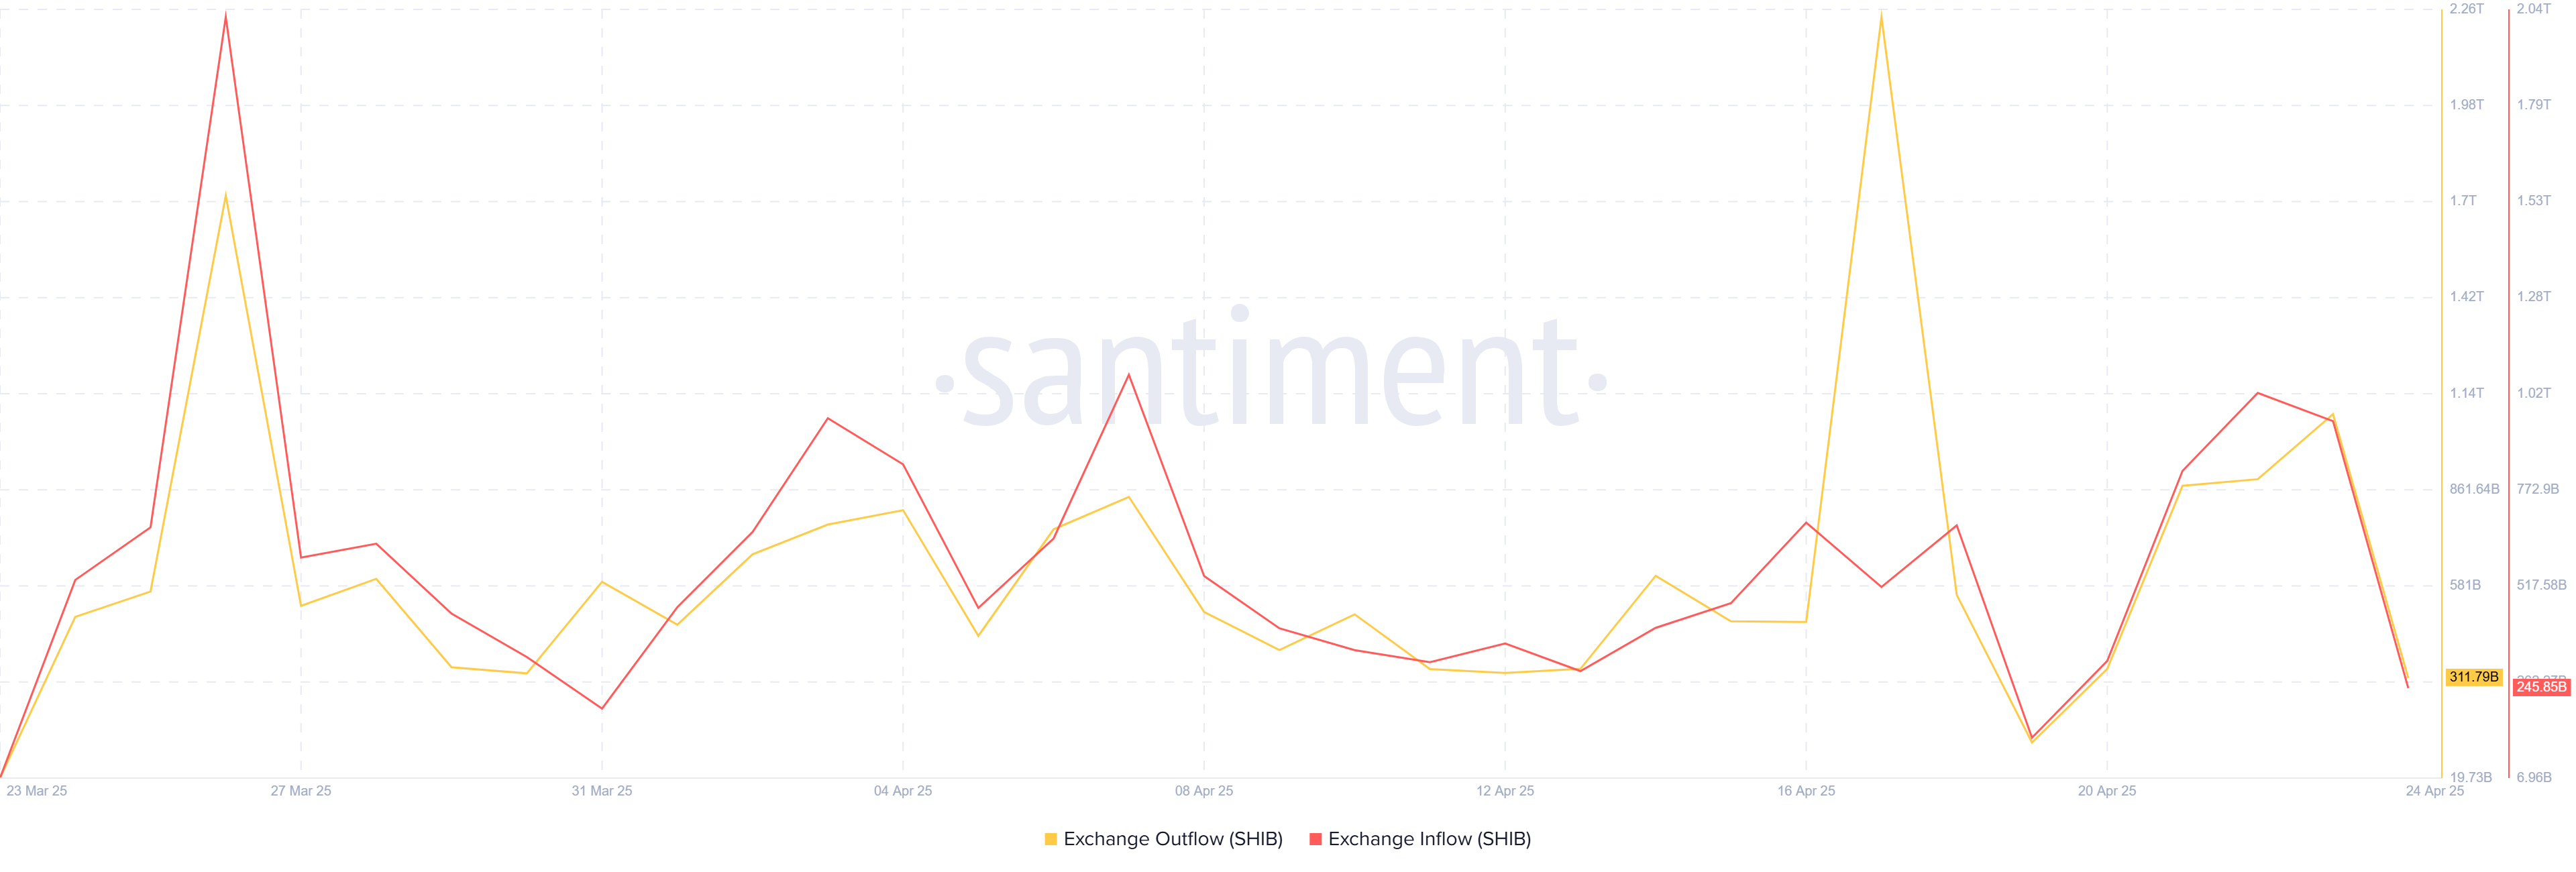
At the same time, on-chain data suggests that most SHIB holders are still hesitant to sell despite the early signs of a reversal after the price dropped by 4%. At press time, data from Santiment revealed that exchange outflows were outpacing inflows. This shows that more traders are willing to hold SHIB rather than sell on exchanges.
These two key metrics – the high open interest and exchange flow data – hint towards trader confidence that the Shiba Inu price will recover and potentially reach $0.00002.
SHIB Technical Analysis as Double Bottom Emerges
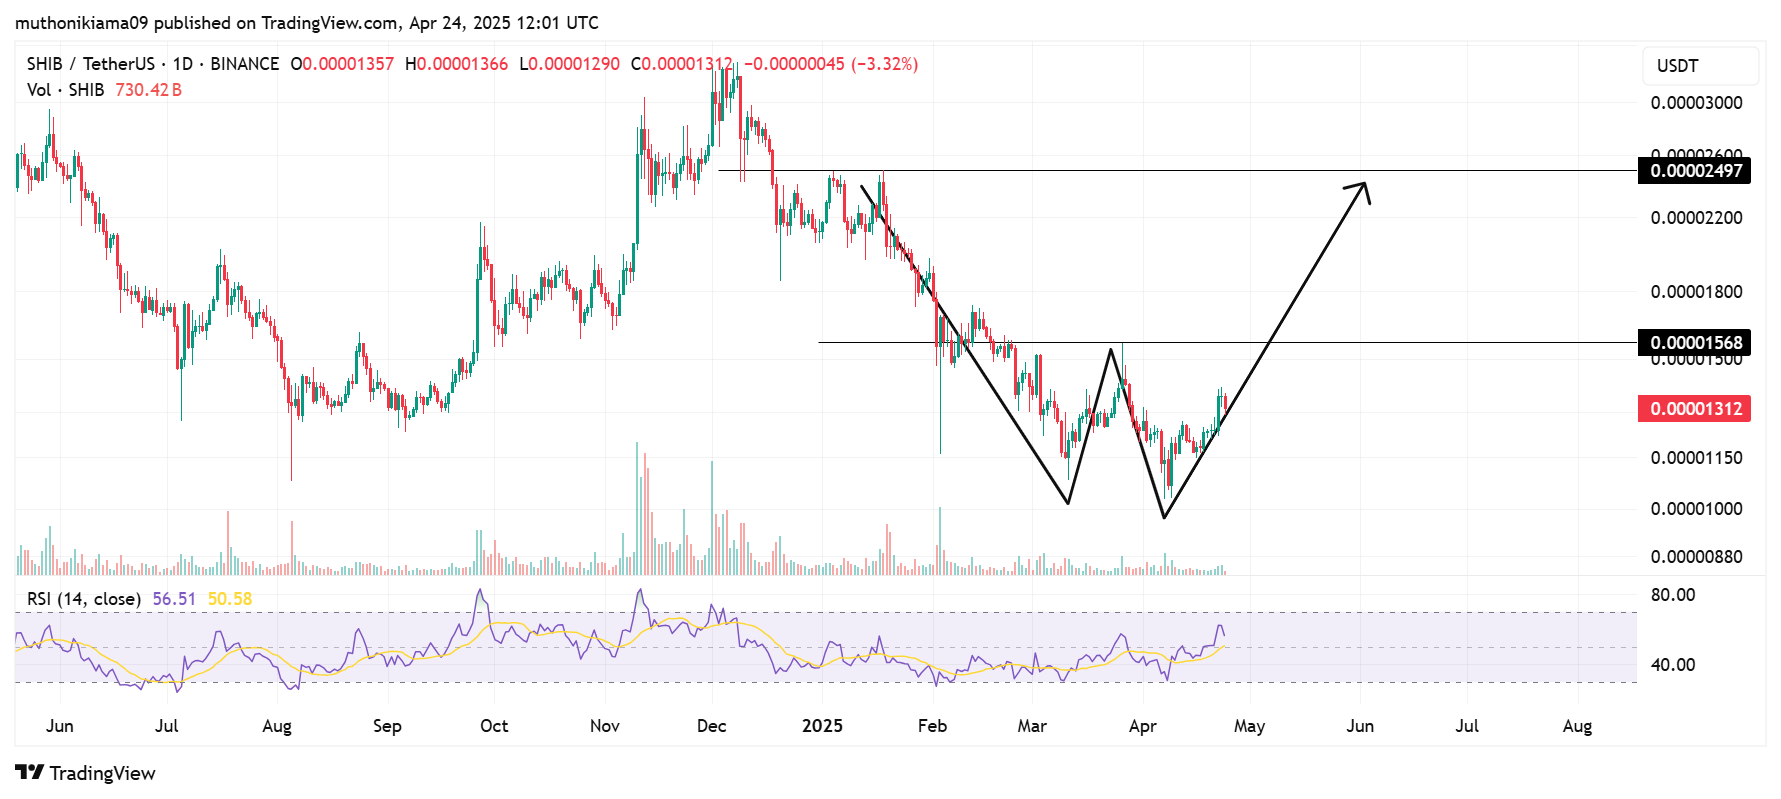
Shiba Inu price might still be poised for more gains as it appears to be forming a massive double bottom pattern on its daily chart. Usually, a double bottom pattern is confirmed when the price breaks the neckline, which in SHIB’s case, lies at $0.000015.
If the ongoing selling activity wanes and the broader market recovers to draw buyers back to the market, SHIB price could flip resistance at $0.000015 and kickstart a strong uptrend. The target price in this double bottom pattern lies at $0.000024.
This double pattern also supports a bullish Shiba Inu price prediction on why a rally to $0.00002 is still likely. However, to achieve this, the RSI indicator needs to resume the uptrend to indicate that a strong bullish momentum is still in play.
In conclusion, the rising open interest, exchange flow data, and the massive double bottom pattern on the daily Shiba Inu price chart show why a rally to $0.00002 is still likely for this meme coin. However, to attain this price, buyers need to step back and help drive the upward momentum.
The post Shiba Inu Price Dips but 2 Key Metrics Suggest $0.00002 Still Likely appeared first on CoinGape.